Tcpdump: The Basics
If you have been going through the TryHackMe networking series, you have probably spent a lot of time in Wireshark by now. Clicking around, following streams, looking at pretty colour-coded packets. Well, this room strips all of that away. No GUI. No clicking. Just a terminal and a tool called Tcpdump that has been around since the late 1980s. It is older than some of the people using it, and it still absolutely gets the job done.
Tasks
- Task 1 — Introduction
- Task 2 — Basic Packet Capture
- Task 3 — Filtering Expressions
- Task 4 — Advanced Filtering
- Task 5 — Displaying Packets
- Task 6 — Conclusion
Task 1 — Introduction
The whole problem with learning networking is that all the interesting stuff is invisible. You send a request, you get a response, and everything in between is just kind of… hidden. You never see the ARP query that figured out the MAC address before your packet could even leave your machine. You never see the three-way TCP handshake that had to happen before any data moved. It all gets abstracted away behind clean interfaces that make everything look effortless.
The best way to understand what is happening is to capture the traffic and look at it yourself. That is exactly what Tcpdump lets you do. It and its underlying library libpcap are written in C and C++, which is a big part of why it is so fast and stable. The libpcap library ended up becoming the foundation for a bunch of other networking tools too. It was also ported to Windows at some point under the name winpcap.
This room covers the core stuff: capturing packets, saving them to a file, filtering what you capture, and controlling how everything gets displayed.
Before you start, the room recommends knowing your way around the TCP/IP model, which the Networking Concepts, Networking Essentials, Networking Core Protocols, and Networking Secure Protocols rooms cover. If those are done, you are good to go.
Question: What is the name of the library that is associated with tcpdump? libpcap
Task 2 — Basic Packet Capture
You can run tcpdump with no arguments at all, but that is basically useless in any real situation. You need to tell it what to listen to, where to write things, and how to display output. This task goes through the core options that make it actually useful.
Choosing a network interface
The first thing you need to decide is which network interface to listen on. You do that with -i INTERFACE. If you want to capture on everything at once, -i any works. If you want something specific like eth0, you just pass that in.
To see what interfaces are available on your machine, you can run ip address show or the shorter version ip a s. It will list whatever network cards are active. On the TryHackMe machine you will see the loopback address and an interface called ens5.
Saving packets to a file
A lot of the time you do not want to just watch packets scroll by in real time, you want to save them and look at them properly later. The -w FILE option does that, and the file extension is almost always .pcap. When you use -w, you will not see anything scrolling in the terminal during capture, which throws some people off the first time. It is just silently writing to the file. You can open .pcap files later with Wireshark or read them back with Tcpdump itself.
Reading packets from a file
To read a saved capture file you use -r FILE. This is really useful for practicing because you can grab a capture, then run different filters against it without having to capture live traffic every time.
Limiting the number of captured packets
If you do not tell Tcpdump to stop, it will just keep going until you hit CTRL-C. If you only want a specific number of packets, you use -c COUNT. Good for quick tests or when you just want a sample.
Stopping address and port resolution
By default, Tcpdump will try to resolve IP addresses into domain names and port numbers into service names. Port 80 becomes http, port 22 becomes ssh, that kind of thing. It makes the output friendlier but it also means Tcpdump is making DNS lookups in the background, which slows things down and can actually interfere with what you are capturing. Use -n to stop IP resolution, or -nn to stop both IP and port resolution. For most practical use, -nn is the better habit.
Here is an example of capturing five packets on ens5 without resolving anything:
sudo tcpdump -i ens5 -c 5 -nn
Getting more detail
If the default output is not giving you enough information, -v adds a bit more, -vv adds even more, and -vvv adds even more than that. According to the manual page, -v will include things like time to live, identification, and total length from IP headers among other things. The manual page (man tcpdump) is worth bookmarking because it goes into far more depth than this room does.
Summary of options covered
tcpdump -i INTERFACEcaptures on a specific interfacetcpdump -w FILEwrites captured packets to a filetcpdump -r FILEreads packets from a filetcpdump -c COUNTcaptures a specific number of packetstcpdump -ndoes not resolve IP addressestcpdump -nndoes not resolve IP addresses or port numberstcpdump -v/-vv/-vvvincreases output verbosity
A few practical examples:
tcpdump -i eth0 -c 50 -vcaptures 50 packets oneth0with verbose outputtcpdump -i wlo1 -w data.pcapcaptures on thewlo1WiFi interface and saves to a file until you stop ittcpdump -i any -nncaptures on all interfaces and shows raw IPs and port numbers with no name resolution
Question: What option can you add to your command to display addresses only in numeric format? -n
Task 3 — Filtering Expressions
Okay so here is where Tcpdump becomes useful. Without filters you are watching every single packet your network card sees, which is a lot. Like trying to follow every conversation at a loud party simultaneously. You need to narrow it down.
Filtering by host
If you only care about traffic going to or coming from a specific machine, you use host IP or host HOSTNAME. Want to capture everything exchanged with example.com? That is sudo tcpdump host example.com -w http.pcap. Easy.
If you want to get more specific, src host IP limits to packets coming from that address, and dst host IP limits to packets going to that address.
Filtering by port
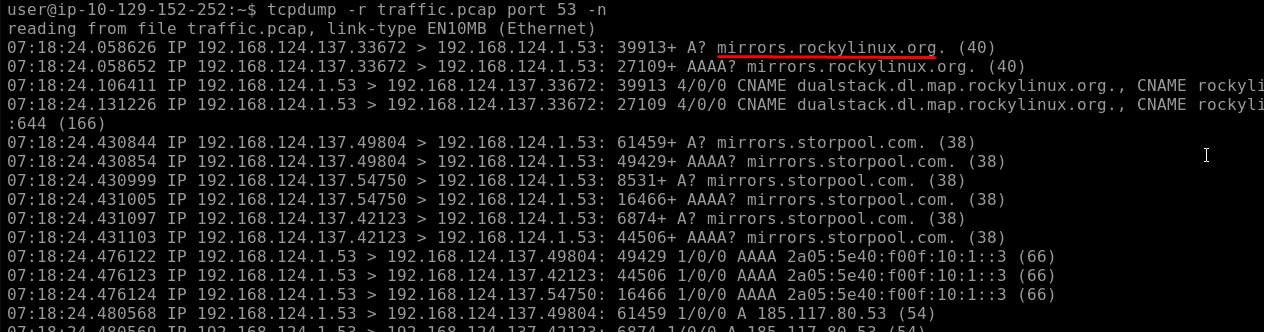
Want all DNS traffic? DNS uses port 53 on both UDP and TCP, so port 53 gets it all. In the terminal output from the room you can see DNS queries and responses, an A record query for an IPv4 address and an AAAA query for IPv6, both going to port 53 on the DNS server.
Same as with hosts, you can use src port PORT_NUMBER and dst port PORT_NUMBER if you need to be more specific about direction.
Filtering by protocol
You can also filter by protocol directly: ip, ip6, udp, tcp, icmp all work as filters. For example sudo tcpdump -i ens5 icmp -n will only show ICMP packets. In the example output the room shows an ICMP echo request and reply, which is someone running ping, and some ICMP time exceeded messages, which is probably someone running traceroute.
Combining filters with logical operators
You can chain filters together using and, or, and not.
andmeans both conditions must be true.tcpdump host 1.1.1.1 and tcpgives you only TCP traffic with that host.ormeans either condition can be true.tcpdump udp or icmpgives you UDP or ICMP traffic.notexcludes matching packets.tcpdump not tcpgives you everything except TCP, so UDP, ICMP, ARP, and so on.
Summary of filter options covered
tcpdump host IPortcpdump host HOSTNAMEfilters by hosttcpdump src host IPfilters by source hosttcpdump dst host IPfilters by destination hosttcpdump port PORT_NUMBERfilters by porttcpdump src port PORT_NUMBERfilters by source porttcpdump dst port PORT_NUMBERfilters by destination porttcpdump PROTOCOLfilters by protocol
A few practical examples:
tcpdump -i any tcp port 22captures SSH traffic on all interfacestcpdump -i wlo1 udp port 123captures NTP traffic onwlo1tcpdump -i eth0 host example.com and tcp port 443 -w https.pcapcaptures only HTTPS traffic withexample.com
Answering the questions
For these questions you read from traffic.pcap using the -r flag. A handy trick: pipe the output through wc to count lines, which gives you the packet count. The room already shows an example of this with tcpdump -r traffic.pcap src host 192.168.124.1 -n | wc.
To find how many ICMP packets are in the file:
tcpdump -r traffic.pcap icmp | wc

To find who asked for the MAC address of 192.168.124.137, that is an ARP question, so you filter by ARP and look for who was asking:
tcpdump -r traffic.pcap arp -n

To find the first DNS query and see what hostname appears:
tcpdump -r traffic.pcap port 53 -n
Question: How many packets in traffic.pcap use the ICMP protocol? 26
Question: What is the IP address of the host that asked for the MAC address of 192.168.124.137? 192.168.124.148
Question: What hostname (subdomain) appears in the first DNS query? mirrors.rockylinux.org
Task 4 — Advanced Filtering
This is where things get a bit more involved. The room introduces filtering based on packet size and, more importantly, filtering based on TCP flags. This stuff is useful once you get your head around it.
Filtering by packet size
Two options here:
greater LENGTHshows packets with a length greater than or equal to the value you giveless LENGTHshows packets with a length less than or equal to the value you give
Binary operations
Before getting into TCP flag filtering, the room explains binary operations because you need them to understand the syntax. There are three to know:
& is AND. It takes two bits and returns 1 only if both inputs are 1. Everything else gives 0.
| is OR. It takes two bits and returns 1 if at least one input is 1. It only returns 0 if both inputs are 0.
! is NOT. It flips the bit. 1 becomes 0, 0 becomes 1.
If you don’t get it, it’s okay, you will learn it eventually in the future with practice.
Header bytes
Tcpdump lets you filter based on specific bytes inside a packet header using the syntax proto[expr:size], where proto is the protocol name (arp, ether, icmp, ip, ip6, tcp, udp), expr is the byte offset starting from 0, and size is how many bytes you are looking at (defaults to 1 if you leave it out).
The room gives two examples from the pcap-filter manual page. The first one, ether[0] & 1 != 0, takes the first byte of the Ethernet header and ANDs it with 1 to check if the packet was sent to a multicast address. The second one, ip[0] & 0xf != 5, takes the first byte of the IP header and checks if the packet has IP options set. These look intimidating but the logic is the same binary AND operation from above, just applied to actual header bytes.
TCP flag filtering
The practical part of this task is filtering on TCP flags. You use tcp[tcpflags] to refer to the flags field in the TCP header. The named flags you can use are:
tcp-synfor the SYN flagtcp-ackfor the ACK flagtcp-finfor the FIN flagtcp-rstfor the RST flagtcp-pushfor the Push flag
To capture packets where only the SYN flag is set and everything else is unset:
tcpdump "tcp[tcpflags] == tcp-syn"
To capture packets where at least the SYN flag is set (other flags might also be set):
tcpdump "tcp[tcpflags] & tcp-syn != 0"
To capture packets where at least SYN or ACK is set:
tcpdump "tcp[tcpflags] & (tcp-syn|tcp-ack) != 0"
Answering the questions
To find packets with only the RST flag set, you use the strict equality version:
tcpdump -r traffic.pcap "tcp[tcpflags] == tcp-rst" | wc

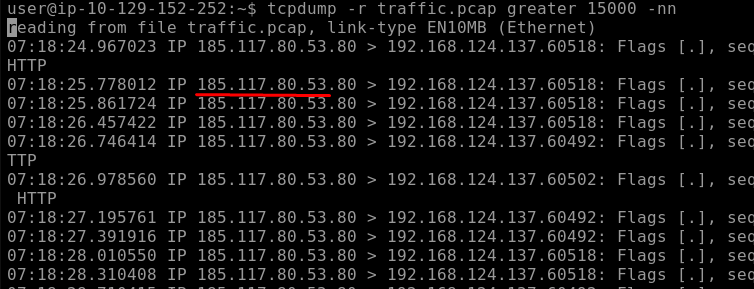
To find who sent packets larger than 15000 bytes:
tcpdump -r traffic.pcap greater 15000 -nn
Question: How many packets have only the TCP Reset (RST) flag set? 57
Question: What is the IP address of the host that sent packets larger than 15000 bytes? 185.117.80.53
Task 5 — Displaying Packets
So far everything has been about what to capture and what to filter. This task is about how the output looks. Tcpdump has a few options that change how packets are printed, and they are all useful in different situations.
The room starts by showing what two packets look like with zero extra options, just tcpdump -r TwoPackets.pcap. You get a timestamp, IP addresses with port numbers, TCP flags, sequence numbers, and some header values. It is reasonably readable but not super detailed.
Brief output with -q
If the default output is too noisy, -q gives you a shorter version. Just the timestamp, source and destination with port numbers, and a brief summary. Good when you just need a quick overview without all the extra header detail.
MAC addresses with -e
Adding -e includes the link-layer header, which means you get the MAC addresses in the output. Useful for protocols like ARP and DHCP where the MAC addresses are kind of the whole point. Also handy if you are trying to track down which physical device is generating suspicious traffic.
ASCII output with -A
-A prints the packet content as ASCII. This works really well when you are looking at unencrypted plain text traffic like old HTTP, because you can actually read the request and response. It does not work nearly as well for encrypted traffic or anything binary, where you just get garbage characters, but for plain text it is great.
Hex output with -xx
-xx displays the packet in hexadecimal format. Every byte is shown as two hex digits. This works regardless of what the content is: encrypted, compressed, binary, it does not matter. You can see every single byte. The downside is that it is not very human-readable unless you know what you are looking at.
Hex and ASCII together with -X
-X is the best of both. You get the hex on the left and the ASCII on the right, side by side. Where bytes correspond to printable ASCII characters you can see them, and where they do not you just see a dot. This is probably the most useful display mode when you are actually trying to dig into packet contents because you get the full picture.
Summary of display options covered
tcpdump -qbrief and quick packet infotcpdump -eincludes MAC addressestcpdump -Aprints packet content as ASCIItcpdump -xxdisplays packets in hexadecimaltcpdump -Xshows packets in both hex and ASCII
Answering the question
To find the MAC address of whoever sent an ARP request, you filter for ARP traffic and add -e to show the link-layer header so the MAC addresses appear in the output:
tcpdump -r traffic.pcap arp -e
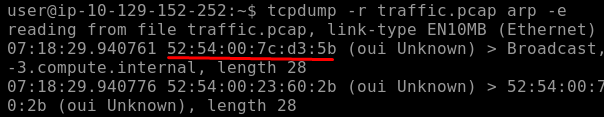
Question: What is the MAC address of the host that sent an ARP request? 52:54:00:7c:d3:5b
Task 6 — Conclusion
That is Tcpdump done. The room covers a solid amount of ground considering how focused it is. You have got the core capture options for choosing interfaces, saving to files, and limiting packet counts. Then the filtering side with host, port, and protocol filters plus logical operators to combine them. Then the more advanced stuff with binary operations and TCP flag filtering. And finally the display options for when you need to actually read what is inside the packets.
The thing about Tcpdump is that once it clicks, it becomes really fast to use. No waiting for a GUI to load, no clicking through menus. You just write the command and get exactly what you need. It is also worth remembering that libpcap, the library underneath it all, is what powers a lot of other tools too, so the filtering syntax you learn here carries over.
The man tcpdump and man pcap-filter pages are worth keeping open when you are working through captures. The room only scratches the surface of what the tool can actually do.